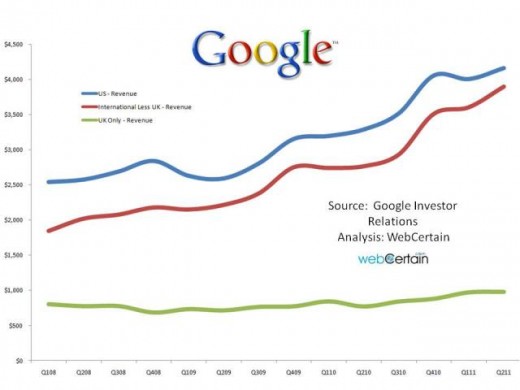
Google received a warm reception to the announcement of its second quarter figures yesterday having been roundly criticised for losing control of its costs last quarter. The topline was a 32% revenue sales growth in the second quarter, compared with one year ago. But that belies what is really happening. Analysis shows that the international activities – excluding the UK – contributed significantly to that performance with a well above average annual growth rate of 41% – effectively powering Google to its result.
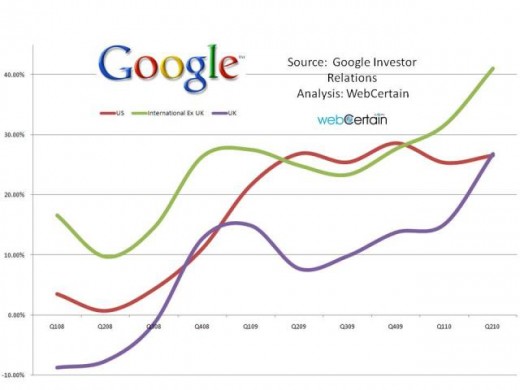
The above chart shows that international has been growing at a faster rate than the US over the last couple of quarters. Meanwhile, the chart below shows the rate of growth in the US compared with the UK and the rest of the world. The sharp upward curve of the green line demonstrates the uptick seen internationally.
The UK also performed better than last quarter – which may partly have been related to improvements in Sterling to Dollar exchange rates. The US improved its rate of growth too, but only just and both the UK and US are both now sitting at growth rates of 26% year on year – representing 15% less annual growth than the rest of the world.
The rate of growth in headcount has continued to accelerate and has grown at a rate faster than the rates of growth in the US and UK – but justified as part of Google’s thrust to capture market share around the world. Larry Page has also gone on record as saying that 2011 will be Google’s biggest year in terms of recruitment – but he then expects the headcount rate to slow. He is also reported as admitting that Google is slightly ahead of its planned headcount. In other words, they recruited more people than they were supposed to so far this year.
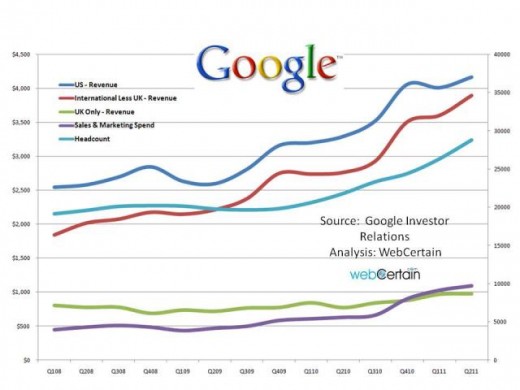
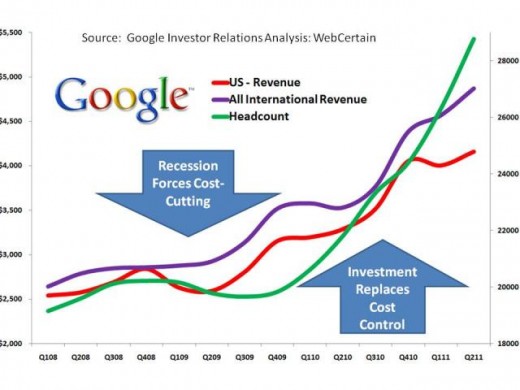
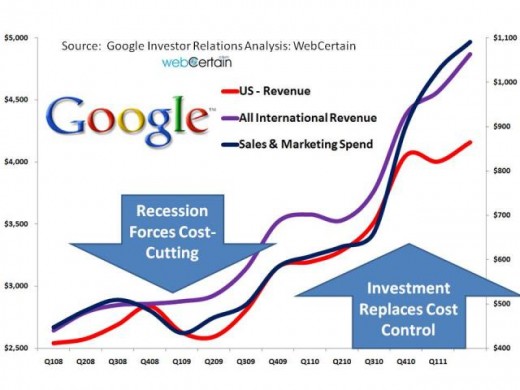
The chart below helps to make transparent the rate of growth of the headcount versus international and US sales. Controls were imposed in 2009, but 2011 has shot up in terms of expenditure following the appointment of Larry Page as CEO. One has to assume that Eric Schmidt would not have taken such large risks and that that is part of the reason for him moving to the position of chairman and leaving Larry to spend Google’s cash as he sees fit.
Now we turn to sales and marketing spend which has now virtually doubled since Larry Page took charge reaching over $1 billion for the first time. The rapid acceleration in sales and marketing investments can been seen in the chart below where – just as with headcount – the rate at which cash has been flowing out of Google’s coffers to generate additional spend has dramatically increased as the black line on the chart demonstrates. Just as with headcount, the increase in sales and marketing spend is justified by the international markets – but not really by the US or the UK.
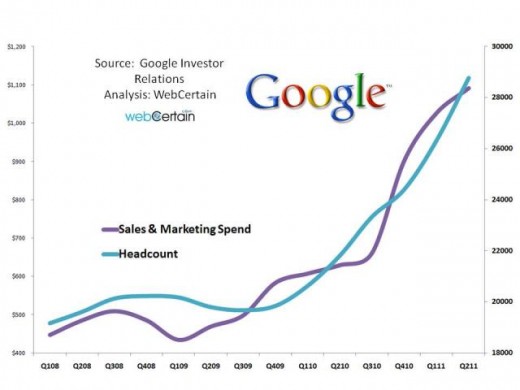
The final chart below on sales and marketing spend and headcount increase demonstrates just how closely these rates of growth mirror each other – which suggests as some have reported that many of the new hires are related to sales. The company has already gone on record as saying that it needs more people with business experience in their sales teams in order to give their customers comfort. Google’s direct deal with Heineken, as reported here in the Financial Times, suggests that part of Google’s longer-term plan may be disintermediation. In other words, Google will deal directly with major advertisers, relegating agencies to the background as something of a nuisance.
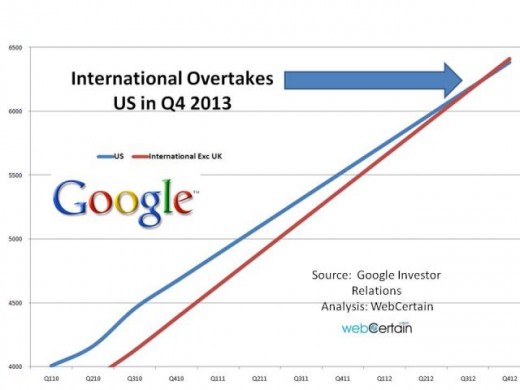
As the volume of rest of world sales accelerates and achieves growth rates well in excess of Google’s domestic market in the US, the question arises as to when non-UK international sales will overtake the US. Of course, combined UK and international sales are already 8% ahead of US sales at $4.870 billion. The chart below extrapolates Google’s announced figures over the last six quarters and forecasts when the rest of the world figures will actually overtake. The answer is in Q4 2013 – so still some six months to go at current rates of growth.
Finally, Google has for the last few quarters only, announced the growth or decline in the values of clicks (CPCs) and in the total number of clicks. Google only releases this in percentage form – so the chart below shows percentage growth or decline in CPCs and numbers of clicks.
What is interesting about this is that, where Google has forced increases in the value of clicks – which has happened twice since the figures became available – the number of clicks drops fairly dramatically – as shown by the two areas circled in green on the chart. As the system of advertising is in essence an auction, increases in bid prices forced through by either the market or Google making adjustments to its quality score, generally seems to bring the volume of clicks down.
Clicks put pressure on Google’s system and add to its overall costs, so the best way for Google to increase margins – particularly at a time when sales and marketing expenditure and headcount are reducing gross margins – is to push up the value of clicks and reduce the volume. Three factors affect this. Firstly, good economic performance will naturally improve Google’s margins because of the increase in competition for clicks. Secondly, if Google can introduce more advertisers and increase competition, it can boost the cost of its advertising services. Thirdly, Google has the ability to push the thresholds at which advertisers are allowed to bid through its quality score.
It is most likely that at the beginning of 2009 Google forced the prices higher in order to insulate itself somewhat from economic troubles. It seems likely that the same process is in play right now to fund Google’s increased internal costs.

Other reporting:
Wall Street Journal
Digital Trends
Talkin Cloud
Search Engine Watch
Search Engine Land
Financial Times
Fins.com
Andy Atkins-Kruger
Latest posts by Andy Atkins-Kruger (see all)
- Launching our new concept – Webcertain In-house! - July 26, 2019
- Yes, the robots are here and they’re running Google Ads! - April 10, 2019
- Be prepared: A personal message from Webcertain’s CEO - May 15, 2018


[…] advertising. According to Bloomberg, the Mountain View company said on its website that the …Google: 41% Growth In International Ad Sales Powers Q2 Financial ResultsMultilingual SearchGoogle Beats The Street As Q2 Sales Hit £5.6 BillioneWEEK Europe UKGoogle Shares […]