 In the Google-dominated Western world, a large percentage of international advertisers use the analytics tool provided by the Californian giant in order to check the effectiveness of their online activities. However, exploring alternatives can provide you with other powerful and free tools.
One of them is Yandex Metrica – an online analytics platform developed by Yandex, Russia’s leading search engine. Yandex Metrica, according to its official definition, is a tool for measuring website traffic and analysing visitors’ behaviour.
It has a very easy-on-the-eye user interface and is very straightforward to use thanks to its logical menus, well-structured dashboards and comprehensive support website – all available in English.
Although mostly used by marketers for tracking the performance of Russian websites, the tool can also provide the same statistics for any website in the world – for example, non-Russian traffic sources such as Western social media – a capability that is often under-appreciated.
1. Setting up a Metrica account
It literally takes a couple of minutes. In order to start working with the tool, you need to have a Yandex email address which you can get by registering at mail.yandex.com. You then log in using your email details to metrica.yandex.com.
In order to start seeing statistics related to your site, a tracking HTML code (called Counter) generated by the tool needs to be placed on each page of the website. If you are interested in tracking conversions, such as form submissions, you will also need to create goals for each conversion type.
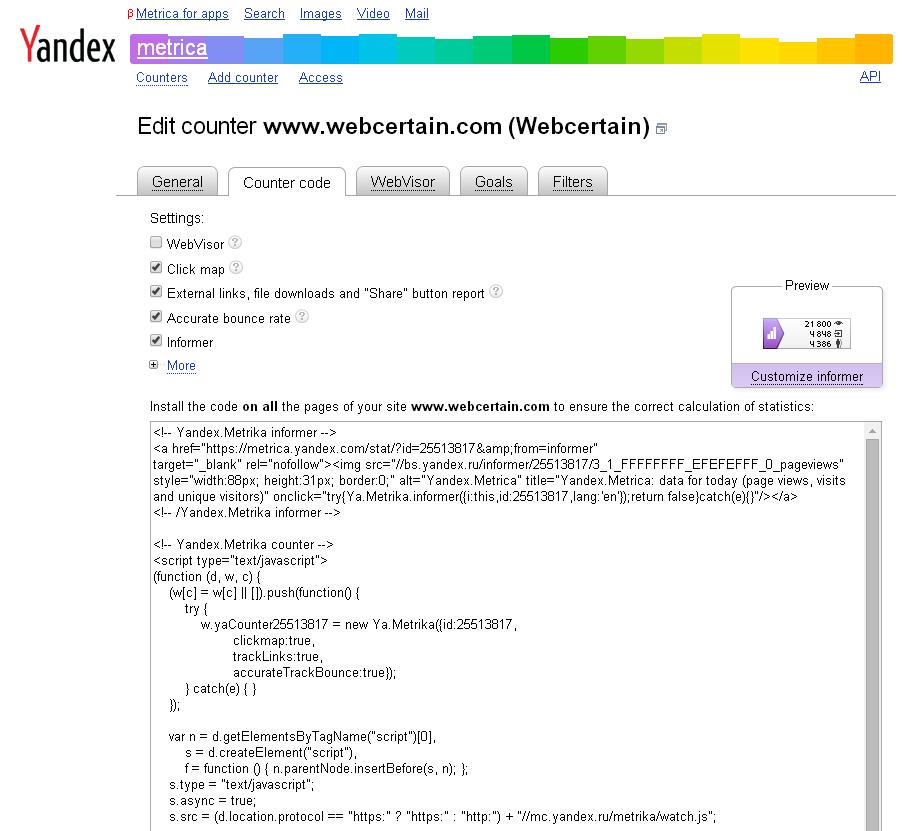
There are four conversion types available to track via Metrica:
- goals related to tracking someone landing on a specific page URL
- achieving a specific amount of page views
- events such as clicks on specific buttons
- multistep goals where you can combine up to five page URLs or events
Download our free guide on how to set up a Metrica account and its goals.
One account in Metrica allows you to track multiple websites, each having its own set of goals.
Yandex Metrica offers an asynchronous code by default in code settings. This type of code does not block or influence the loading speed of your site. It also doesn’t matter where the code is placed (e.g. in the header, body or the footer) because even if someone decides to leave the page before it loads completely it will still be classed as a ‘visit’.
It is also important to bear in mind that each tracking system defines ‘visits’ differently and the visit data would not match in any two tracking systems taken together because of the different algorithms.
2. Yandex Metrica reports
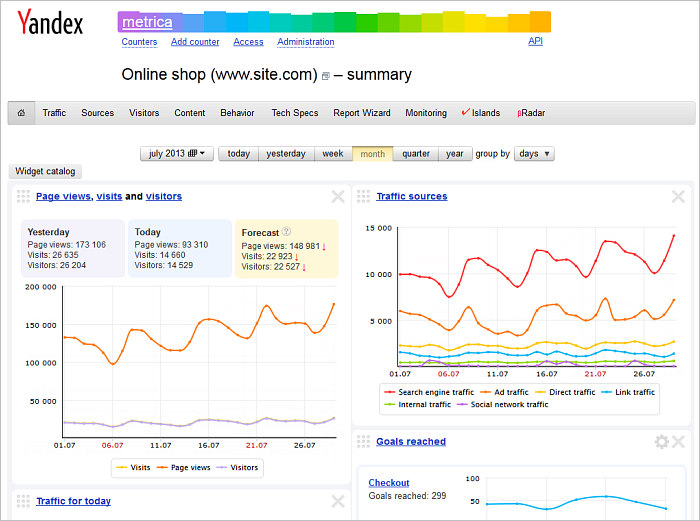
Visitors’ actions are reflected in Metrica’s reports between 30 seconds and five minutes after the actions, whereas all the other statistics are updated every 30 seconds. All data is displayed in a table as well as in a variety of neatly presented graphs.
In general, the available statistics can be divided into the following categories:
I) Traffic and source reports
This section will help you to understand:
a) Where the traffic is coming from – all visitors’ sources are divided into the following categories:
b) Some standard information on how the traffic is behaving on your site, for example the number of pages viewed, bounce rate, time on site, conversion rates etc.
Important note! Bounce rate is calculated differently between Google Analytics and Yandex Metrica and these figures will differ significantly when comparing the two tools.
Yandex will classify someone as ‘bounced’ (i.e. they left the website) only if they spent less than 15 seconds on one page before exiting the website. However, if the user converts during those 15 seconds and then leaves the website it will not be counted as ‘bounce’. The 15 second rule can be changed in the Yandex settings – to find out how, click here (Accurate TrackBounce).
According to Google Analytics’ help section, bounce rate is calculated by this tool as a percentage of visits in which users view only a single page of your site, therefore even if a visitor spends ten minutes on your site reading an article and then exits the website it will still be considered as ‘bounced’!
%GC_SERVICE=993%
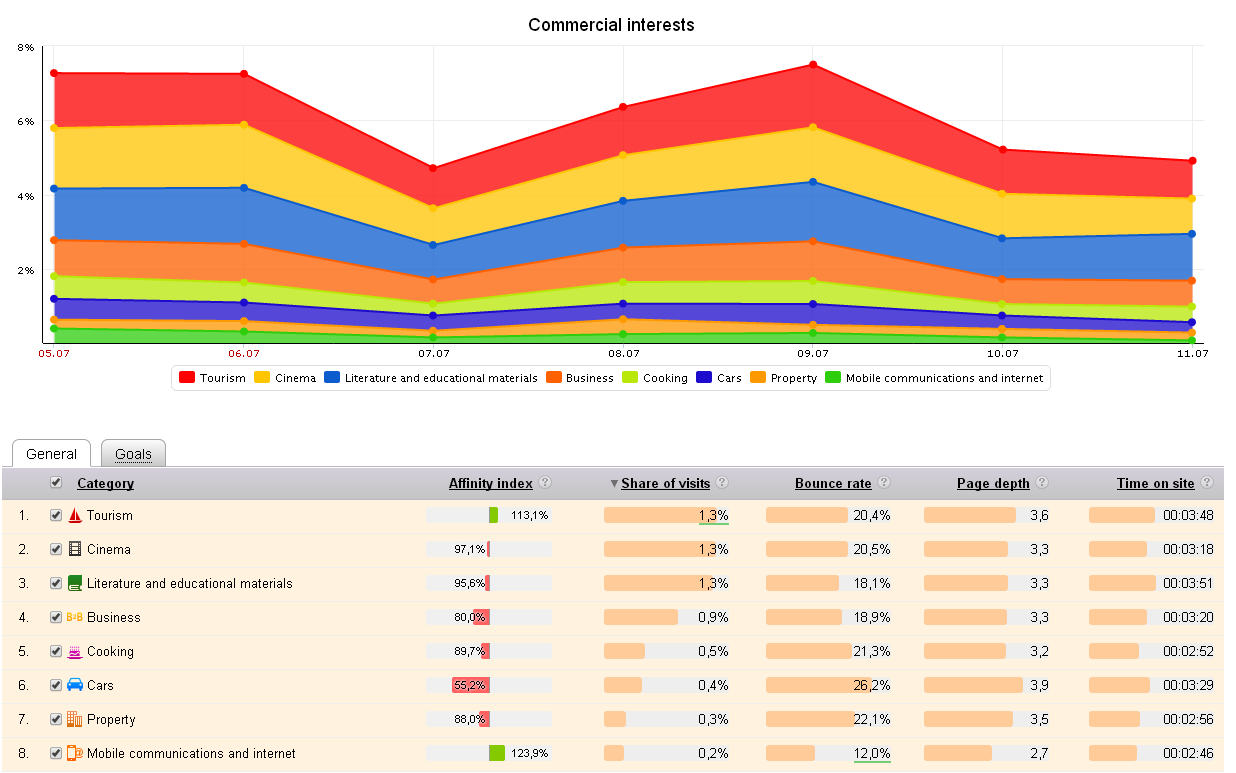
c) Which region your visitors are coming from, plus their gender, age and commercial interests
Visitors’ interests are calculated by analysis of their behaviour on the internet using analytics technology called Crypta. This technology classifies web users based on their previous online actions. Crypta is based on Yandex’s own machine learning method MatrixNet. To learn more about Crypta and how it collects data, click here.
d) The sources that lead visitors to the site: ads, search queries, social networks, etc.
II) Content reports
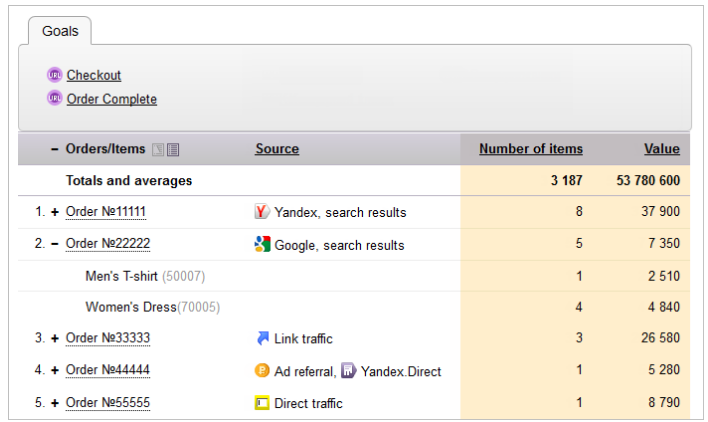
Shows statistics on visitors’ interaction with the site’s content such as entry and exit pages, traffic from external links, file downloads, orders made by visitors and their costs, as well as custom parameters for visits (if you modified the counter code on your site so that it transmits this data to Metrica). It can provide owners of online stores with detailed information about each order placed online as in the example shown below.
III) Behaviour reports
By far the best part of Metrica and something which makes the tool extremely interesting and puts it way above the other free tools! Here is what this section allows you to do:
WATCH A RECORDING OF A USER VISIT IN A VIDEO FORMAT
My absolute favourite amongst all known analytics options and a shocker to see at first! Ever wondered how people behave when they land on your website? Now using Metrica you can see a recording of every visit (up to 1,000 per day)! You can filter and group users based on many dimensions (for example location, operating systems, browsers etc.) and watch how they interacted with your site. To see an example and read more about WebVisor, click here.

I once spent a whole evening watching these videos and I might as well have had popcorn with me as it was a fascinating movie! If you think that your visitors behave rationally (or what you would like to think the rational journey would be) start watching a few videos and you will quickly change your mind!
There are companies out there which focus their whole business offering on providing video recordings like the ones available for free in Metrica!
ANALYSE USER BEHAVIOUR WHEN FILLING OUT WEB FORMS
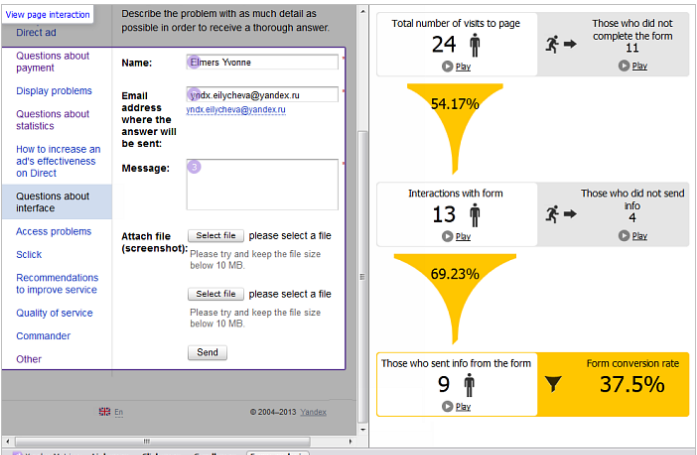
Form analysis is a great tool for companies that collect conversions data via order forms or contact forms. It helps to understand how exactly the site’s users interact with your forms.
The tool provides information on the number of views of the page containing the form, the number of interactions with the form, the data on sent forms as well as the video recordings of how people behaved when filling in the form!
For those marketers who are not sure if their form is too long, it is a great tool for establishing which fields put visitors off from completing it.
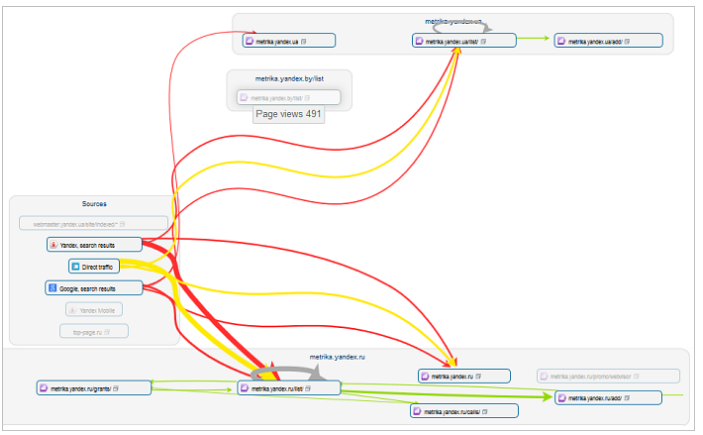
CLICK PATH ANALYSIS
Shows the users’ main navigation paths on your site in a graph.
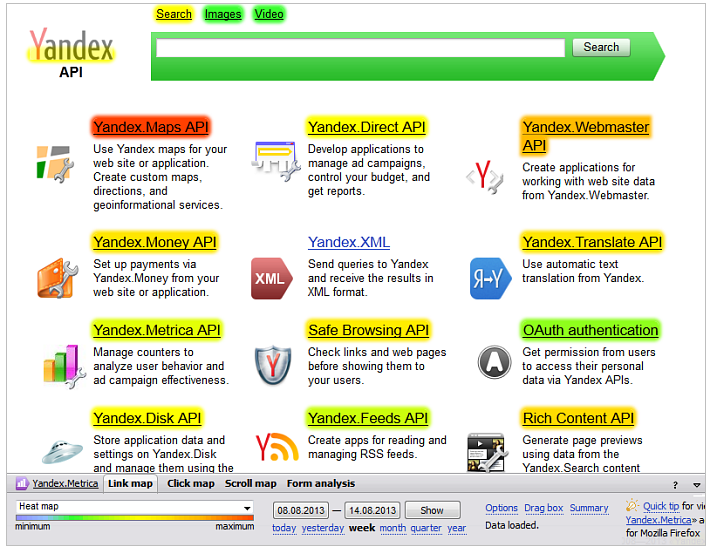
LINK MAP ANALYSIS
A tool for analysing link click stats for your site.
Links are highlighted in different colours on the map depending on their popularity. Warm and bright colours are used to represent popular links on the heat map, while cold and pale colours indicate unpopular links. If you hover your mouse over a link, you can see the number of hits on the link and the percentage of hits out of the total for that page.
HEAT MAPS
In Metrica, these are called ‘click maps’ and they measure and display statistics for clicks on your site. Unlike the link map, the click map shows clicks on all page elements and not just on links.
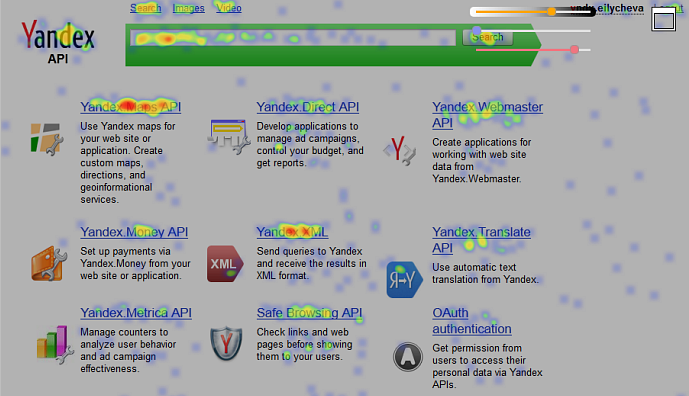
There is a variety of map display modes, for example a monochrome, transparent map as well as a 3D map – you will need a pair of 3D glasses to use this option.
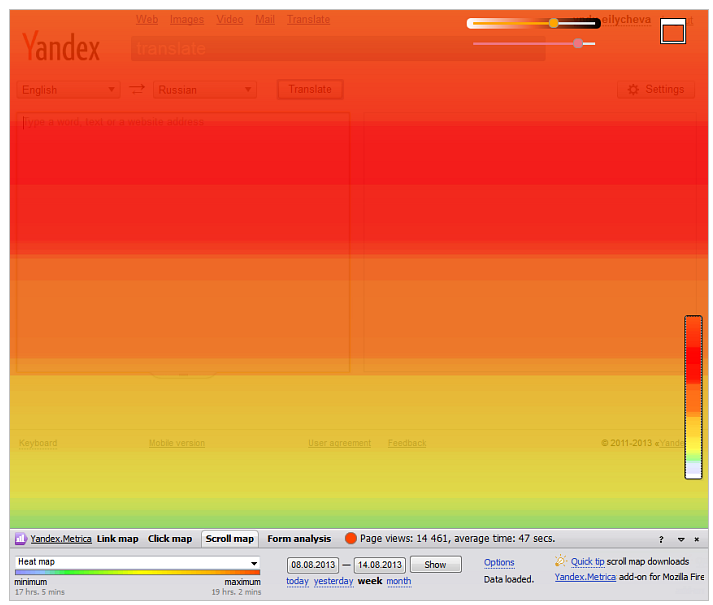
SCROLL MAP
This is a tool for analysing how site users’ attention was divided among particular areas of the page. By using the scroll map, it’s possible to find out how the users of long sites view different elements of the page. This information helps site owners to select the best page length and establish a strategy on the correct placement of information.
IV. Technology
This category of reports provides statistics on performance by browsers, operating systems devices, monitor resolution, devices, Java, Silverlight and Flash.
V. Report builder
Allowing you to create your own report from all the statistics available with a variety of filters and segmentation options to choose from.
VI. Monitoring
Metrica can track when your website is down and provides a report on this data. If you connect your account with Yandex Direct (the PPC advertising account), Metrica will switch off your ads to prevent unnecessary spend and it will send you an email saying that it did it – brilliant simplicity and a money saver!

VII. Islands
This is the latest development from Yandex. Islands are interactive snippets with answers in Yandex search results – and Metrica provides reports on these ‘islands’. For more information, watch the following video:
No Man Is An Island from Yandex on Vimeo.
3. A few other reasons to use Yandex Metrica
If the above overview of the reports available was not enough to persuade you to look into Metrica, here are a few more reasons why you should consider doing so, especially if you advertise on Yandex Direct:
- Only via Yandex Metrica can you correctly track conversions from your paid campaigns driven by the Yandex Direct PPC platform.
- Only Metrica provides you with search query reports from paid search campaigns (Yandex Direct doesn’t show this data).
- As mentioned above, Metrica helps you save money by switching off your advertising campaigns when your website is down.
- The wide variety of user behaviour reports helps in gaining information on how to best optimise your landing pages.
- Only via Metrica can you check the bounce rate and time on site – metrics especially important for assessing your paid search campaigns if you don’t track any other conversion types.
- Once you link Yandex Direct account to Metrica you will also be able to track calls from the website.
Knowing that alternatives exist doesn’t harm anyone, and if anything, it broadens one’s spectrum of choices.
Metrica is a great option, especially for those using Yandex Direct. It should be explored by those interested in monitoring their website usability, as it can be very supportive in improving user experience and ultimately business performance.





8 responses
Hi Justyna,
Congratulations for the post, it is really useful.
I am thinking to implement it. I have some doubts regarding to the data and implementation.
– Do you know if Yandex Analytics allow Multi Domain?
– Do you know if YA collect transactions?
– Google Analytics has some restrictions in Chinese market, Does Yandex Analytics have the same problem?
Thank you so much and Congrats!!
hi Eugenio!
I’m glad you found my post useful and happy to find out that you are thinking about implementing Metrica- it really is a powerful and super easy tool to use! 🙂
Here are the answers to your questions:
1.Yes, you can track multiple domains via one account in Metrica or create an MCC account for all you Metrica accounts
2. Yes. If you’d like to send revenue data for each redirect/transaction to Metrica than you need to configure e-commerce parameters and then send these values through parameters. You can find more info about e-commerce parameters and how to set them via this link – http://help.yandex.ru/metrika/reports/e-commerce.xml
3. Metrica has no restrictions in China.
Hope this is useful.
Good luck! 🙂
Justyna
Hi Justyna
I discovered YM a few weeks ago – loving it!
The session replay is simply sensational.
I have a question – you mention ‘Click Path Analysis’… but I can’t find it in my YM dashboard – is it still there? And if yes, where?!
Many thanks.
Hi Gideon,
Welcome to the Yandex Metrica fan group! 🙂 The Click Path Analysis report changed its name ever since I wrote the blog and can now be found in Maps – Click Map
Enjoy! 🙂
Hi Justyna
🙂 Last week I took the plunge and didn’t even bother adding GA to a new site – just went with YM.
I must be going mad… I can see the click map but still cannot find the report that “Shows the users’ main navigation paths on your site in a graph.” the one that’s equivalent to GA Behaviour Flow!
You forgot to mention Yandex Metrica’s webvisor which I wrote about on my blog: http://itz-sold.com/yandex-metrica-a-good-addition-to-google-analytics/
Hi Alex. Perhaps you need to read my blog post a bit more carefully because Webvisor (or Session Replay as it’s now called) was indeed explained in detail together with an example 🙂
The clickmap and scroolmap and webvisor are features that works on some sites and they do not work on other sites.
So these features are usually totally useless.
When they fix it they will be good but now they are not good at all.